Plotting function
Usage
# S3 method for class 'emuFit'
plot(
  x,
  plot_key = NULL,
  title = NULL,
  taxon_names = NULL,
  display_taxon_names = TRUE,
  data_only = FALSE,
  ...
)
Arguments
- x
Output from emuFit()
- plot_key
(Optional) Default
NULL. List of named vectors containing names in the "covariate" column of thecoefoutput of the radEmu model object. If you wish for multiple covariate values to be plotted on the same plot, then those variables should be included in the same named vector. By default, each column of the design matrix receives its own plot.- title
(Optional). Default
NULL. Character string. The main title for the graphic.- taxon_names
(Optional). Default
NULL. Data frame. IfNULL, keep taxon names as listed in radEmu model. Otherwise, users can input a data frame with two columns: one labelled "category" with the same levels as in the radEmu output and another labelled "cat_small" with the preferred labels.- display_taxon_names
(Optional). Default
TRUE. Boolean. IfFALSE, remove sample names from the plot.- data_only
(Optional). Default
FALSE. Boolean. IfTRUE, only returns data frame.- ...
There are no optional parameters at this time.
Examples
data(wirbel_sample_small)
data(wirbel_otu_small)
ch_fit <- emuFit(formula = ~ Group + Study,
data = wirbel_sample_small,
Y = wirbel_otu_small,
run_score_tests = FALSE,
tolerance = 0.01)
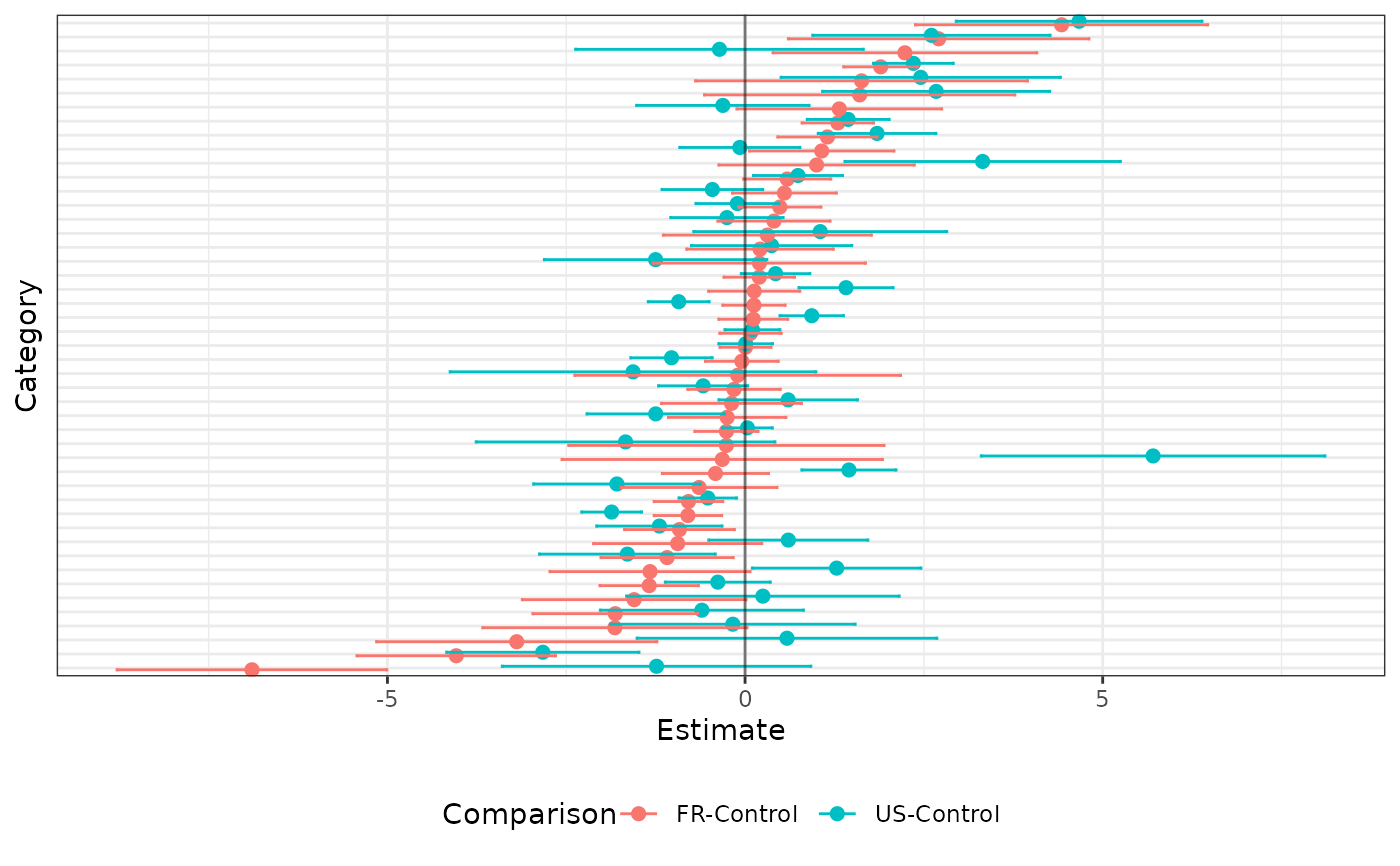
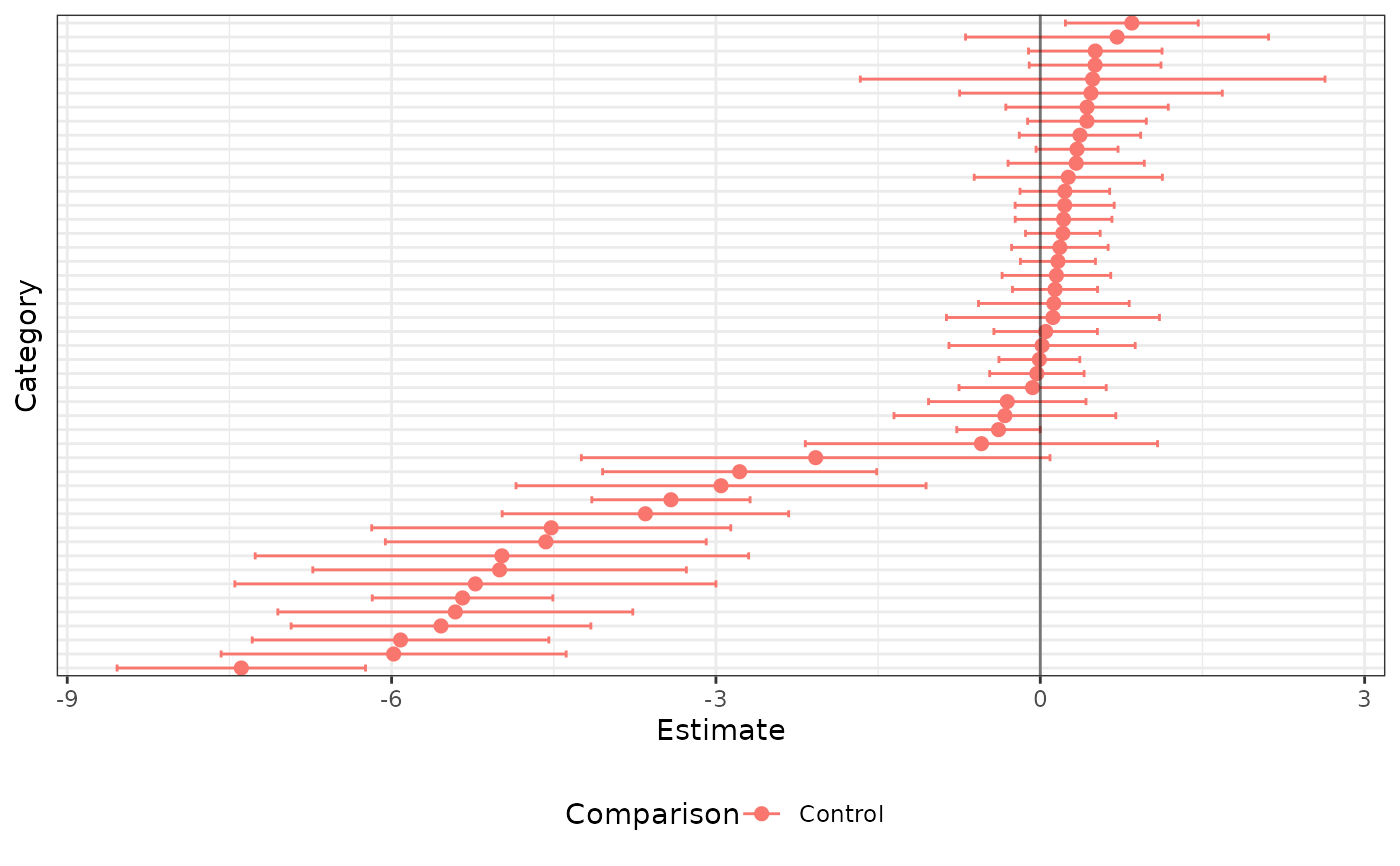
plot_key <- list(p1 = c("Control" = "GroupCTR"),
p2 = c("FR-Control" = "StudyFR-CRC",
"US-Control" = "StudyUS-CRC"))
out <- plot(x = ch_fit,
plot_key = plot_key,
display_taxon_names = FALSE)
out$plots$p1
 out$plots$p2