EBAME: Differential Abundance with anvi'o ouput
Maria Valdez, Amy D Willis
Last updated October 18 2026
ebame_da_pt3.RmdBackground
This lab covers “differential abundance” using metagenomics data,
emphasizing using the outputs of anvi’o’s
anvi-estimate-scg-taxonomy function.
It specifically covers the differential abundance method
radEmu. We like this method because it estimates changes in
the “absolute abundance” of microbial taxa, even without absolute
quantification data. Here, “absolute abundance” could be interpreted on
the cell count, cell concentration or DNA concentration scale. Yes! It’s
true! (We talked about it in lecture.)
We’ll illustrate its use on the the Healthy Dairy Workers dataset. We’re interested in estimating changes in microbial abundances before versus after commencing dairy work.
First let’s load libraries we’ll need. Install radEmu
only if you don’t already have it installed.
library(tidyverse)
if (!("radEmu" %in% row.names(installed.packages()))) {
  remotes::install_github("statdivlab/radEmu")
}
library(radEmu)
This is optional, but helpful to make some R packages be friends:
select <- dplyr::selectDownloading and reading in metadata
You can download the data here. (We’ve found this website to be convenient for this purpose.)
The metadata is from SRA. Let’s read it in, and remove all columns that are identical for all samples.
meta <- read.table("../data/hdw_metadata.tsv", header = TRUE, row.names = 1) %>%
  as_tibble %>%
  select(where(~ n_distinct(.) > 1))
head(meta)
## # A tibble: 6 × 4
## sample_id host_subject_id collection_date replicate.number
## <chr> <chr> <chr> <int>
## 1 S200_V00 S200 2018-03-15 1
## 2 S200_V11 S200 2018-06-25 1
## 3 S200_V22 S200 2018-10-11 1
## 4 S200_V33 S200 2019-03-10 1
## 5 S200_V44 S200 2020-11-09 1
## 6 S201_V00 S201 2018-06-19 1We can see the study collected samples at different points in time
(collection_date) from different hosts
(host_subject_id). How many hosts do we have? And how many
visits per host?
## # A tibble: 9 × 2
##   host_subject_id     n
##   <chr>           <int>
## 1 S200                5
## 2 S201                5
## 3 S207                4
## 4 S208                4
## 5 S210                4
## 6 S211                3
## 7 S212                3
## 8 S213                3
## 9 S214                4
Creating and loading coverage data
To save time, we’re not going to work with the sequences directly –
we did that for you in advance. But how did I make the data we’re going
to give you? I did coassemblies within subject, then ran
anvi-run-scg-taxonomy on each of my contigs databases. From
there, I estimated the taxonomy as follows:
for file in 03_CONTIGS/*-contigs.db; do
  base=$(basename "$file" -contigs.db)
  profile="06_MERGED/${base}/PROFILE.db"
  output="11_MGX_TAXONOMY/${base}_S2.txt"
  anvi-estimate-scg-taxonomy -c $file -p $profile --compute-scg-coverages --metagenome-mode -o $output --scg-name-for-metagenome-mode Ribosomal_S2
done
You can see that these results went in a folder called
11_MGX_TAXONOMY.
(Side note – you could probably adapt the below tutorial to work with
anvi-profile-blitz. If you’re using blitz and
want to do differential abundance, let us know and we’ll expand this
tutorial!)
To run radEmu, we need a table with samples in the rows,
taxa in the columns, and entries corresponding to the coverages of each
taxon in each sample. So, we have to turn this data into that form.
We’re going to aggregate at the species level (i.e., we will sum the
coverage of different strains within the same species).
Here’s how you can do that (you can go through this slowly in your own time, and adapt it to your own data). We also remove the negative control samples, which are not useful for differential abundance (but useful for many other things!).
coverages_all <- list.files("../data/11_MGX_TAXONOMY/",pattern = "^S.*txt", full.names = T) %>%
  lapply(FUN = read_tsv) %>%
  bind_rows() %>%
  separate(scg_name, sep = "_", into = c("sample_profile_db", NA, "marker", "strain")) %>%
  select(-percent_identity, -marker, -strain, -NEG_UWTrinh_BS_0001_F05, -NEG_UWTrinh_BS_0001_H05) %>%
  pivot_longer(S200_V00:S214_V2B,
               names_to = "sample_coverage", values_to = "coverage") %>%
  filter(sample_profile_db == substr(sample_coverage,1,4)) %>%
  select(-sample_profile_db) %>%
  rename(sample = sample_coverage) %>%
  group_by(sample, t_domain, t_phylum, t_class, t_order, t_family, t_genus, t_species) %>%
  summarise(coverage = sum(coverage)) %>%
  ungroup() %>%
  mutate(taxa = paste0("d__", t_domain, ";p__", t_phylum,
                       ";c__", t_class, ";o__",t_order,";f__",t_family,
                       ";g__", t_genus, ";s__",t_species)) %>%
  mutate(sp_name = ifelse(t_species == "None", taxa, t_species) %>% str_replace(" ", "_"))

coverages <- coverages_all %>%
  select(sample, coverage, sp_name) %>%
  pivot_wider(values_from = coverage, values_fill = 0, names_from = sp_name) %>%
  column_to_rownames(var="sample")
How many species are there?
dim(coverages)## [1] 35 472Based on the dimensions of the metadata and coverage data, how are these data tables related?
rownames(coverages)## [1] "S200_V00" "S200_V11" "S200_V22" "S200_V33" "S200_V44" "S201_V00"
## [7] "S201_V11" "S201_V22" "S201_V33" "S201_V44" "S207_V0A" "S207_V0B"
## [13] "S207_V2A" "S207_V2B" "S208_V0A" "S208_V0B" "S208_V2A" "S208_V2B"
## [19] "S210_V0A" "S210_V0B" "S210_V1A" "S210_V1B" "S211_V00" "S211_V11"
## [25] "S211_V22" "S212_V00" "S212_V11" "S212_V22" "S213_V00" "S213_V11"
## [31] "S213_V22" "S214_V0A" "S214_V0B" "S214_V2A" "S214_V2B"
meta$sample_id## [1] "S200_V00" "S200_V11" "S200_V22" "S200_V33" "S200_V44" "S201_V00"
## [7] "S201_V11" "S201_V22" "S201_V33" "S201_V44" "S207_V0A" "S207_V0B"
## [13] "S207_V2A" "S207_V2B" "S208_V0A" "S208_V0B" "S208_V2A" "S208_V2B"
## [19] "S210_V0A" "S210_V0B" "S210_V1A" "S210_V1B" "S211_V00" "S211_V11"
## [25] "S211_V22" "S212_V00" "S212_V11" "S212_V22" "S213_V00" "S213_V11"
## [31] "S213_V22" "S214_V0A" "S214_V0B" "S214_V2A" "S214_V2B"To keep things simple, if there are technical replicates, we will retain only one. For this, we will remove all samples labelled with a “B” at the end.
coverages <- coverages[!endsWith(rownames(coverages), "B"), ]
meta <- meta %>%
  filter(!endsWith(sample_id,"B"))
Remember that we’re interested in estimating fold-changes in
microbial abundances before compared to after commencing dairy work. So,
we will create a variable called exposed, which will
differentiate between samples collected at baseline (FALSE:
very first sample collected for each host) and those collected after
exposure (TRUE: samples collected subsequently).
meta <- meta %>%
  rownames_to_column("Rownames") %>%
  group_by(host_subject_id) %>%
  mutate(exposed = (min(collection_date) < collection_date)) %>%
  ungroup() %>%
  column_to_rownames(var="Rownames")
Check we have one exposed and the rest unexposed:
## # A tibble: 18 × 3
## # Groups:   host_subject_id [9]
##    host_subject_id exposed     n
##    <chr>           <lgl>   <int>
##  1 S200            FALSE       1
##  2 S200            TRUE        4
##  3 S201            FALSE       1
##  4 S201            TRUE        4
##  5 S207            FALSE       1
##  6 S207            TRUE        1
##  7 S208            FALSE       1
##  8 S208            TRUE        1
##  9 S210            FALSE       1
## 10 S210            TRUE        1
## 11 S211            FALSE       1
## 12 S211            TRUE        2
## 13 S212            FALSE       1
## 14 S212            TRUE        2
## 15 S213            FALSE       1
## 16 S213            TRUE        2
## 17 S214            FALSE       1
## 18 S214            TRUE        1
So that radEmu knows now to connect the metadata and the
coverage data, we need to put the sample labels in the row names:
rownames(meta) <- meta$sample_idFinally, to run radEmu, we need to confirm that all species are detected in at least one sample. (Even if it was true at the beginning, we could have taxa that were only in the removed samples.)
## [1] 27 46927 samples, 469 species, woohoo!
Phew! That was a lot of data processing! That’s usually most of the work!
Now, we can estimate fold-differences.
Fitting a model
The function that we use to fit our model is called
emuFit. Here’s the arguments that we will use:
-
formula: This is a formula tellingemuFitwhat predictors to use. We are using justexposed, but your model could be much more complicated. -
data: The metadata table. -
Y: A matrix or data frame containing our observed abundance data. For us, it’s the coverage table. The rows give the observations (samples), and the columns give the categories (species). -
cluster: (Optional) If samples are correlated, the name of the ‘’groups’’ to which each sample belongs to, making them not independent. In our case, samples from the same host form clusters.
There’s one more important argument to know about:
-
run_score_tests: (Optional) A logical value denoting whether or not to run score tests.
Say NO for now! We’ll come back to this.
Let’s see how the model fitting looks with the variables explained above! This code should take less than a minute to run.
system.time({hdw_fit <- emuFit(formula = ~ exposed,
                               data = meta,
                               Y = coverages,
                               cluster = meta$host_subject_id,
                               run_score_tests = FALSE)})
## user system elapsed
## 1.752 0.020 1.773Less than a minute?! Two seconds – woohoo! (Props to Sarah Teichman for a lot of amazing improvements to the estimation algorithm during 2025 that made this possible.)
Let’s look at our results and talk through them together.
hdw_fit##
## Call:
## emuFit(Y = coverages, formula = ~exposed, data = meta, cluster = meta$host_subject_id,
## run_score_tests = FALSE)
##
##
## Coefficient estimates with the largest magnitudes:
## covariate
## 4 exposedTRUE
## 395 exposedTRUE
## 55 exposedTRUE
## 3 exposedTRUE
## 101 exposedTRUE
## 50 exposedTRUE
## 353 exposedTRUE
## 11 exposedTRUE
## 273 exposedTRUE
## 56 exposedTRUE
## 433 exposedTRUE
## 15 exposedTRUE
## 95 exposedTRUE
## 160 exposedTRUE
## 77 exposedTRUE
## 448 exposedTRUE
## 232 exposedTRUE
## 173 exposedTRUE
## 290 exposedTRUE
## 109 exposedTRUE
## category
## 4 Bifidobacterium_bifidum
## 395 Dialister_sp002320515
## 55 Ruminococcus_B_gnavus
## 3 Bifidobacterium_animalis
## 101 Phocaeicola_massiliensis
## 50 d__Bacteria;p__Bacillota_A;c__Clostridia;o__Lachnospirales;f__Lachnospiraceae;g__Merdisoma;s__None
## 353 CALXCQ01_sp944386835
## 11 d__Bacteria;p__Actinomycetota;c__Coriobacteriia;o__Coriobacteriales;f__Eggerthellaceae;g__Eggerthella;s__None
## 273 CAG-353_sp900066885
## 56 d__Bacteria;p__Bacillota_A;c__Clostridia;o__Lachnospirales;f__Lachnospiraceae;g__Ventrimonas;s__None
## 433 Angelakisella_sp900552845
## 15 d__Bacteria;p__Bacillota;c__Bacilli;o__Erysipelotrichales;f__Coprobacillaceae;g__Thomasclavelia;s__None
## 95 Megasphaera_elsdenii
## 160 d__Bacteria;p__Verrucomicrobiota;c__Verrucomicrobiae;o__Verrucomicrobiales;f__Akkermansiaceae;g__Akkermansia;s__None
## 77 Vescimonas_sp000435975
## 448 Merdousia_sp900548275
## 232 UMGS1901_sp900553755
## 173 d__Bacteria;p__Bacillota;c__Bacilli;o__Lactobacillales;f__Lactobacillaceae;g__Weissella;s__None
## 290 d__Bacteria;p__Pseudomonadota;c__Gammaproteobacteria;o__Enterobacterales;f__Enterobacteriaceae;g__Citrobacter;s__None
## 109 Alistipes_onderdonkii
## category_num estimate se lower upper
## 4 4 7.558651 0.5347847 6.510492 8.606810
## 395 395 6.544570 0.9669870 4.649311 8.439830
## 55 55 5.613179 0.9524578 3.746396 7.479962
## 3 3 -5.463178 0.8907873 -7.209089 -3.717267
## 101 101 5.215436 0.9514173 3.350693 7.080180
## 50 50 5.196918 0.4441021 4.326494 6.067343
## 353 353 5.032484 0.1982493 4.643922 5.421045
## 11 11 5.015379 0.9507151 3.152012 6.878747
## 273 273 -4.997699 0.9625110 -6.884186 -3.111212
## 56 56 4.936816 0.9503985 3.074069 6.799563
## 433 433 -4.873355 1.0008124 -6.834911 -2.911798
## 15 15 4.820096 0.9498799 2.958365 6.681826
## 95 95 4.657158 0.9490467 2.797061 6.517256
## 160 160 4.580213 0.8838203 2.847957 6.312469
## 77 77 4.545697 0.9483934 2.686880 6.404514
## 448 448 -4.444996 0.9952876 -6.395723 -2.494268
## 232 232 -4.347533 0.4432158 -5.216220 -3.478846
## 173 173 -4.329899 0.9239539 -6.140815 -2.518983
## 290 290 -4.307836 0.9534645 -6.176592 -2.439080
## 109 109 4.290305 0.2800716 3.741375 4.839235## To obtain the entire coefficient table, use the command `emuFit_object$coef`.The printed output is sorted by the largest estimated effect sizes
(fold differences), but how do we look at a specific species? The way to
access estimated coefficients and confidence intervals from the model is
with hdw_fit$coef. Let’s look at one:
hdw_fit$coef[52, ] ## covariate category category_num estimate se
## 52 exposedTRUE Oliverpabstia_intestinalis 52 2.411388 0.06976821
## lower upper score_stat pval
## 52 2.274645 2.548132 NA NAInterpreting the results
Let’s interpret these results! Here’s three equivalent interpretations:
-
We estimate that the average abundance of Oliverpabstia_intestinalis in metagenomes is 11 times greater after commencing dairy work, when compared to the typical fold-differences in the average abundance of taxa across these visits. (Yep – that’s a ratio of ratios.)
- Where did 11 come from? It’s raised to the power of 2.4
We estimate that the log-fold difference in the average abundance of Oliverpabstia_intestinalis in metagenomes from visits post and prior exposure is 2.4 greater than the typical log-fold difference in the average abundance of taxa across these groups. (That’s a difference in differences.)
Under the assumption that most taxa do not differ in average abundance between visits post and prior exposure, we estimate that the abundance of Oliverpabstia_intestinalis in metagenomes from post exposure visits is 11 times greater than prior exposure visits.
By default, radEmu compares the log-fold difference in
one taxon to the typical (approximately the median) log fold
difference in all taxa. However, radEmu is very flexible!
For example, we can compare log-fold differences to the log-fold
difference for a specific (or reference) taxon. This
vignette shows you how to modify your code to use a reference taxon
(useful if you spiked-in a taxon).
Ok, that’s one taxon’s fold-difference estimate. Let’s look at all the estimates:
hdw_fit$coef %>%
  arrange(estimate) %>%
  mutate(order = 1:n()) %>%
  ggplot(aes(x = order, y = estimate)) +
  geom_point() +
  geom_errorbar(aes(ymin = lower, ymax = upper), alpha = 0.3) +
  labs(x = "", y = "Estimate (with 95% confidence interval)") +
  ggtitle("Log fold-difference estimates") +
  theme(plot.title = element_text(hjust = 0.5))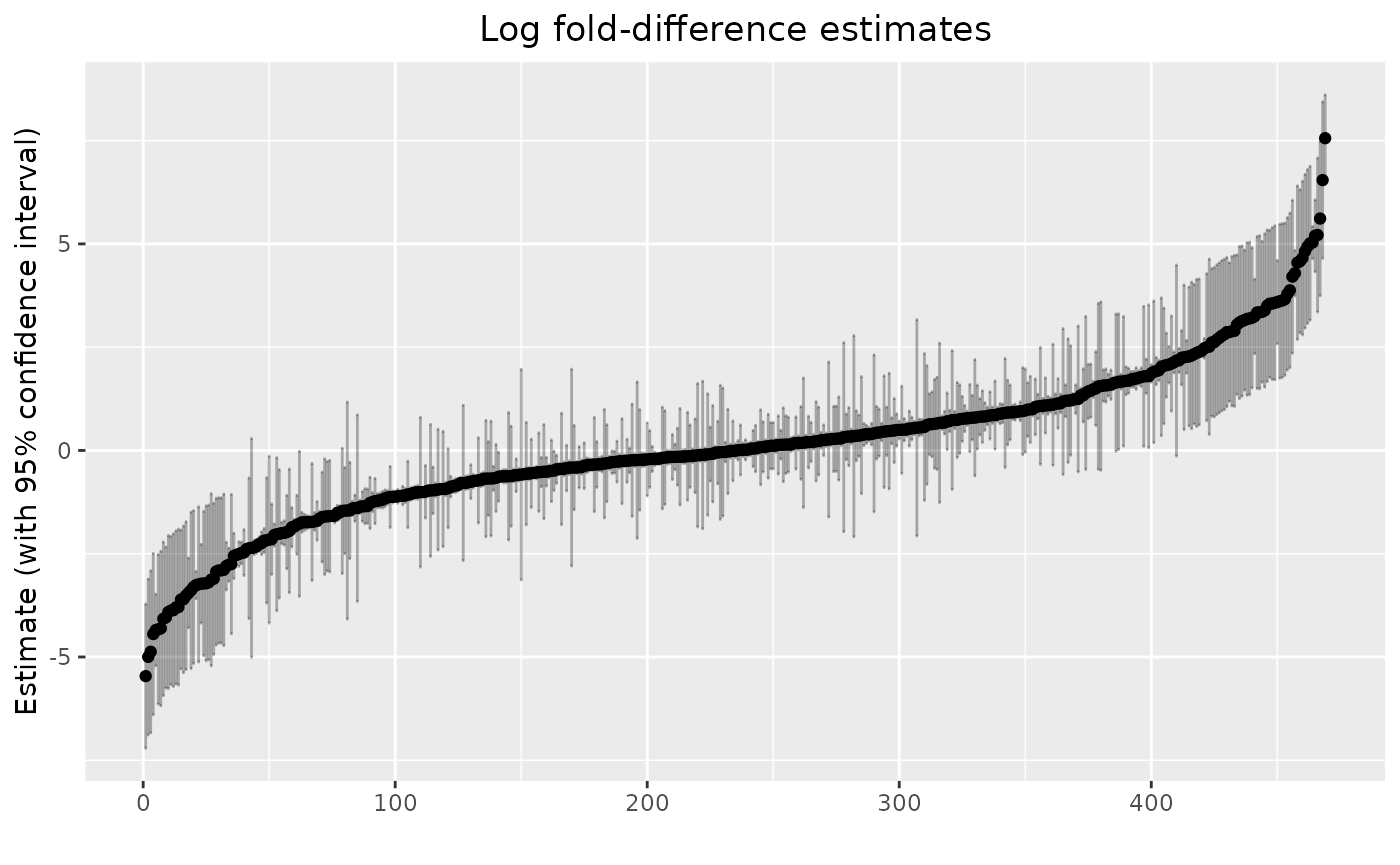
Here we can see the distribution of log fold-difference estimates from our model, as well as 95% confidence intervals.
Is this even reasonable?
A quick check: let’s look at the taxon with the maximum fold-difference, and see if the data is consistent with a large fold-difference.
max(hdw_fit$coef$estimate)## [1] 7.558651## [1] 1917.257
who_largest_diff <- hdw_fit$coef %>%
  tibble %>%
  filter(abs(estimate) == max(abs(estimate))) %>%
  pull(category)
meta %>%
  add_column(coverage = coverages[[who_largest_diff]]) %>%
  select(sample_id, exposed, coverage)
## sample_id exposed coverage
## 1 S200_V00 FALSE 0.00000
## 2 S200_V11 TRUE 66.49854
## 3 S200_V22 TRUE 252.01276
## 4 S200_V33 TRUE 244.21329
## 5 S200_V44 TRUE 0.00000
## 6 S201_V00 FALSE 0.00000
## 7 S201_V11 TRUE 0.00000
## 8 S201_V22 TRUE 0.00000
## 9 S201_V33 TRUE 0.00000
## 10 S201_V44 TRUE 0.00000
## 11 S207_V0A FALSE 0.00000
## 12 S207_V2A TRUE 0.00000
## 13 S208_V0A FALSE 0.00000
## 14 S208_V2A TRUE 0.00000
## 15 S210_V0A FALSE 0.00000
## 16 S210_V1A TRUE 0.00000
## 17 S211_V00 FALSE 0.00000
## 18 S211_V11 TRUE 363.30792
## 19 S211_V22 TRUE 192.85163
## 20 S212_V00 FALSE 0.00000
## 21 S212_V11 TRUE 0.00000
## 22 S212_V22 TRUE 259.47017
## 23 S213_V00 FALSE 0.00000
## 24 S213_V11 TRUE 0.00000
## 25 S213_V22 TRUE 0.00000
## 26 S214_V0A FALSE 0.00000
## 27 S214_V2A TRUE 0.00000Wowzer!! It definitely looks like this taxon colonized a few participants after they began dairy work – consistent with a large and positive effect size. Who is it?
who_largest_diff## [1] "Bifidobacterium_bifidum"Hypothesis tests and p-values
In your papers, please look at and interpret your estimates, don’t just report p-values.
Now, let’s talk about testing the null hypothesis that a species doesn’t differ in its average abundance before vs after exposure. While its tempting to use the confidence intervals to just say “p<0.05” or “not p<0.05”, there’s a MUCH more reliable way. Robust score tests are the reliable option – but they also take some time.
Real talk – there’s a perfect way to get these p-values, and
there’s a very good but way faster way. The faster way is what
we’ll show you here, and uses the package fastEmu. (The
perfect way is with radEmu.) On this dataset, the speedup
was
and the average difference was
%
(based on a random sample of 25 taxa).
if (!("fastEmu" %in% row.names(installed.packages()))) {
  remotes::install_github("statdivlab/fastEmu")
}
library(fastEmu)
Let’s start by getting two p-values (using one core), then I’ll show you how to get them all (in parallel).
To set up this test, we run fastEmuFit, giving it the
fitted values that it has already found:
-
formula,data,Yandclusterare as before -
hdw_fitis our previous fitted object (the output ofemuFit) -
test_kja data frame listing the indices of the parameters (inhdw_fit$B) that we want to test.
taxa_to_test <- c(134, 372)
covariate_to_test <- which("exposedTRUE" == hdw_fit$B %>% rownames)
two_robust_score_tests <- fastEmuFit(formula = ~ exposed,
                                     data = meta,
                                     Y = coverages,
                                     cluster = meta$host_subject_id,
                                     fitted_model = hdw_fit,
                                     test_kj = data.frame(k = covariate_to_test,
                                                          j = taxa_to_test),
                                     # have it tell you when it runs score tests
                                     verbose = TRUE)
Let’s take a look at the test output.
two_robust_score_tests$coef[taxa_to_test, ]## covariate category category_num estimate se
## 134 exposedTRUE Clostridium_sp900543325 134 -2.157053 1.0189175
## 372 exposedTRUE Clostridium_sp000435835 372 2.299542 0.9101272
## lower upper score_stat pval reference_category
## 134 -4.1540945 -0.1600113 1.677088 0.1953118 FALSE
## 372 0.5157255 4.0833583 1.055472 0.3042503 FALSEBased on this, we do not have strong statistical evidence to conclude the fold-difference in abundance of these two taxa before and after exposure is any different than the typical fold-difference. Here’s an example interpretation appropriate for a paper:
We estimate that the average abundance of Clostridium_sp900543325 in metagenomes is 8.6 times greater before commencing dairy work, when compared to the typical fold-differences in the average abundance of taxa across these visits (95% CI 1.2–64; $p = $ 0.2).
Testing all taxa in parallel
In many data analyses, we’d like to run tests for all taxa that we
have measured. I don’t recommend running this today, but I’ll
show you how to set it up. There’s a full vignette here
(for the fastEmu approach) and here
(for the radEmu approach).
Here are the steps for the parallel workflow in
fastEmu:
- Fit the model with
emuFit(if you haven’t already) - Fix the reference taxa with
fastEmuFitset (to keep it consistent across the parallel runs) - Test each taxon, also with
fastEmuFit
DO NOT RUN THIS UNLESS YOU HAVE THE TIME AND COMPUTING RESOURCES! It might take… 15 minutes on our cluster?
ncores = parallel::detectCores() - 1
## We did Step 0 already:
# hdw_fit <- emuFit(formula = ~ exposed,
#                                data = meta,
#                                Y = coverages,
#                                cluster = meta$host_subject_id,
#                                run_score_tests = FALSE)

## Step 1: fix the reference taxa
fast_ref_set <- fastEmuFit(formula = ~ exposed,
                           data = meta,
                           Y = coverages,
                           cluster = meta$host_subject_id,
                           fitted_model = hdw_fit,
                           reference_set = "data_driven",
                           run_score_tests = FALSE,
                           verbose = TRUE)

## Step 2: Test each taxon
## First, create a function to deploy in parallel
fastEmuTest_fn <- function(category) {
  score_res <- fastEmuFit(formula = ~ exposed,
                          data = meta,
                          Y = coverages,
                          cluster = meta$host_subject_id,
                          fitted_model = fast_ref_set,
                          test_kj = data.frame(k = covariate_to_test,
                                               j = category),
                           verbose = TRUE)
  return(score_res)
}
## Then, run the function
if (.Platform$OS.type != "windows" & !identical(Sys.getenv("GITHUB_ACTIONS"), "true")) {
  # run if we are on a Mac or Linux machine
  score_res <- parallel::mclapply(1:ncol(coverages),
                                  fastEmuTest_fn,
                                  mc.cores = ncores)
} else {
  # don't run if we are on a Windows machine, or if testing with GitHub actions
  # You can do it! You just would need a different setup. Please reach out!
  score_res <- NULL
}

if (!is.null(score_res)) {
  c(score_res[[1]]$coef$pval[1], ## robust score test p-value for the first taxon
    score_res[[2]]$coef$pval[2]) ## robust score test p-value for the second taxon
}

# Now, merge the results together
if (!is.null(score_res)) {
  full_score <- sapply(1:length(score_res),
                       function(x) score_res[[x]]$coef$score_stat[x])
  full_pval <- sapply(1:length(score_res),
                      function(x) score_res[[x]]$coef$pval[x])
  full_coef <- hdw_fit$coef %>%
    select(-score_stat, -pval) %>%
    filter(category_num %in% 1:ncol(coverages)) %>%
    mutate(score_stat = full_score,
           pval = full_pval)
  full_coef
}
By the way – running this many tests is probably quite reasonable, but the computation time increases as the number of predictors and number of taxa increases.
That there are tradeoffs to using fastEmu – it is an
approximate test, and the results may differ compared to the “gold
standard” of testing with radEmu. I would recommend running
fastEmu first, then re-running any particularly interesting taxa with
radEmu. Note – if you take this approach, you must do false
discovery correction on the full set of taxa you tested, not just the
interesting subset that you re-ran!!
Finally, although this example uses a single binary covariate,
radEmu and fastEmu can be run with more
complex regression models.
A quick constrast with other methods
radEmu isn’t the only differential abundance method.
Some other popular alternatives include ALDEx2,
ANCOM-BC2, and DESeq2. Each of these methods
(and the many differential abundance methods that we didn’t consider
here) have pros and cons. Here’s a list of our opinions on these
methods. These critiques are data-driven, but definitely reflect
our bias.
-
radEmu- pros: low bias, has Type I error rate control in all settings that we tested, handles sparsity well
- cons: robust score tests are slow, especially in data sets with a large number of categories (taxa, genes, etc.)
-
fastEmu- pros: inherits
radEmupros, is much faster thanradEmu(especially with a large number of categories) - cons: an approximate method (rather than an exact method) with a less intuitive target parameter, still slower than several other methods
- pros: inherits
-
ALDEx2- pros: very biased/variable estimates, has Type I error rate control
in many situations, faster than
radEmuto test all categories - cons: has very low power, handles zeroes poorly/weirdly
- pros: very biased/variable estimates, has Type I error rate control
in many situations, faster than
-
ANCOM-BC2- pros: low bias, high power, faster than
radEmuto test all categories - cons: terrible error rate control (i.e. not a valid test), can’t handle data separation (a common consequence of sparsity), relies on questionable sensitivity analysis
- pros: low bias, high power, faster than
-
DESeq2- pros: very biased/variable estimates, faster than
radEmuto test all categories - cons: fails to control Type I error in some situations, tailored for RNA-seq data, not microbiome data, its own developers recommend against it for microbiome data
- pros: very biased/variable estimates, faster than
-
LinDA- pros: faster than
radEmuto test all categories, high power in some settings - cons: biased for largest effect sizes, fails to control Type I error in some situations (large sample sizes with sparse data), handles zeroes poorly/weirdly
- pros: faster than
Check out the documentation for each of these packages for more information and more practice using them.